Have you ever edited a photo that looked perfect on your screen, only to find it looked completely different on another display or in print? That is exactly why the Lightroom histogram is one of the most important tools in your editing workflow. Unlike your eyes, which can be fooled by monitor brightness and ambient lighting, the histogram gives you objective, mathematical data about your exposure.
In this guide, I will show you exactly how to use the histogram in Lightroom to fix exposure problems. You will learn to read the graph, identify clipping, and develop a reliable workflow for correcting both overexposed and underexposed images. After editing thousands of photos over the years, I have learned to trust the histogram more than my own eyes, and this guide will help you do the same.
What Is the Lightroom Histogram?
The Lightroom histogram is a graphical representation of all the tonal values in your photo, displayed as a mountain-like graph. The horizontal axis shows brightness levels from pure black on the left to pure white on the right. The vertical axis shows how many pixels exist at each brightness level. Taller peaks mean more pixels at that particular tone.
This graph exists because your monitor can lie to you. A calibrated display in a dark room will show your image differently than an uncalibrated screen in bright sunlight. The histogram removes subjectivity from exposure evaluation. It tells you the truth about your image regardless of how it appears on screen.
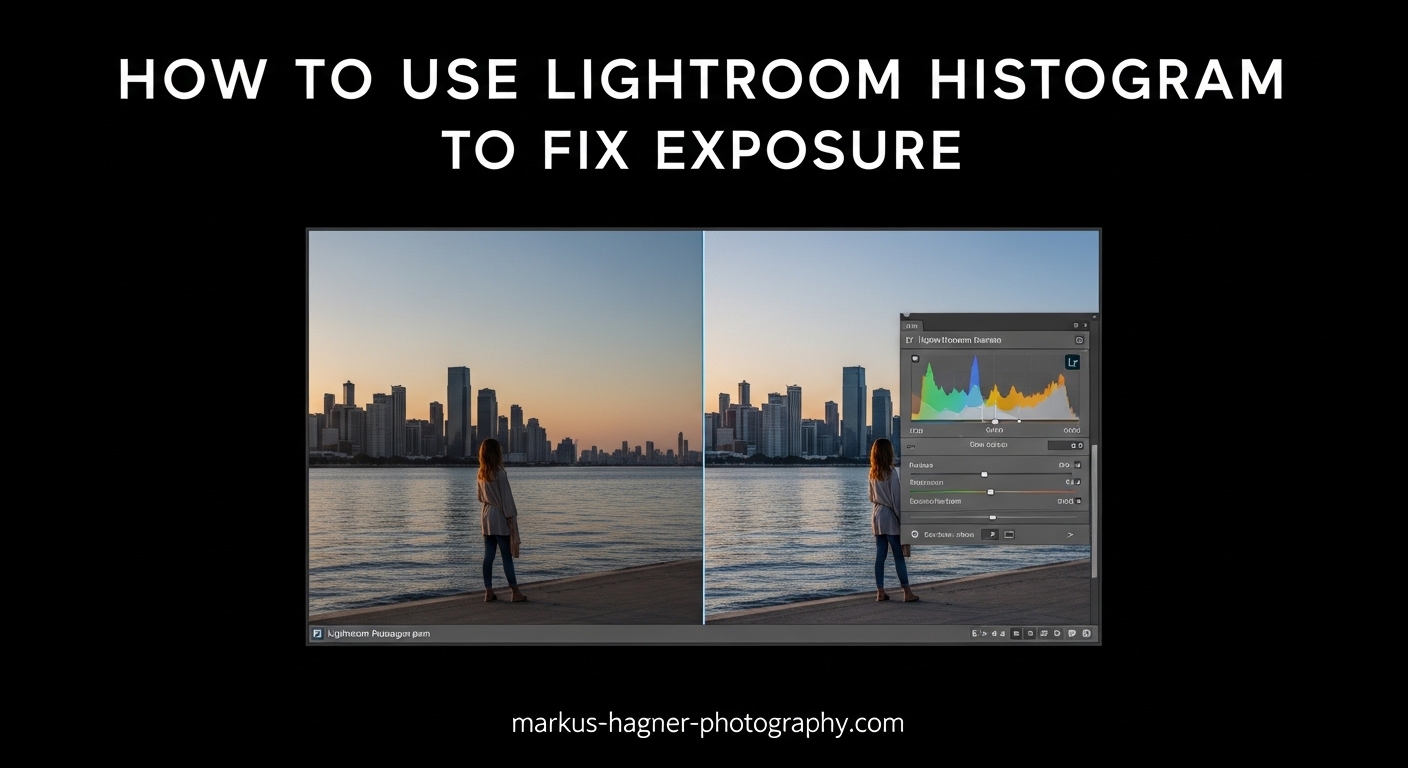
You will find the histogram in the top-right corner of both the Library and Develop modules. In the Develop module, it sits above the Basic panel and provides real-time feedback as you make adjustments. Every slider you move changes the shape of this graph.
How to Read the Histogram in Lightroom
Reading the histogram is straightforward once you understand the basic concept. The graph is divided into five zones from left to right: blacks, shadows, midtones, highlights, and whites. Think of it as a map of your image’s brightness distribution.
The far left edge represents pure black. If you see a tall peak jammed against this edge, you have crushed blacks, meaning shadow detail has been lost to complete darkness. The far right edge represents pure white. Peaks touching this edge indicate blown highlights, where bright areas have become featureless white.
The center of the histogram represents midtones, which is where most well-exposed images show their highest peaks. A properly exposed photo typically has a bell-curve shape with the bulk of pixels concentrated in the middle, gradually tapering toward both edges without significant clipping.
However, there is no such thing as a perfect histogram shape. A snowy winter landscape will naturally show peaks on the right side. A nighttime cityscape will cluster toward the left. The key is understanding what the graph tells you about your specific image and whether that distribution matches your creative intent.
Finding and Enabling the Histogram
In Lightroom Classic, you will find the histogram in the top-right panel of both the Library and Develop modules. It appears automatically and cannot be hidden in the Develop module. If you do not see it in the Library module, press the J key or go to View > Show Histogram from the menu bar.
The most valuable feature of the Lightroom histogram is the clipping warnings, which are controlled by two small triangles in the top corners of the histogram panel. The left triangle shows shadow clipping, and the right triangle shows highlight clipping. When these triangles light up, you have lost detail in those areas.
Press the J key on your keyboard to toggle clipping warnings on and off. When enabled, clipped shadows appear as blue overlay on your image, and clipped highlights appear as red overlay. This visual feedback makes it incredibly easy to spot exposure problems without constantly watching the histogram itself.
You can also click directly on either triangle to lock that warning on. Many experienced photographers keep these warnings enabled throughout their entire editing process. I recommend doing the same until reading the histogram becomes second nature.
Understanding Clipping in Lightroom
Clipping occurs when tonal values exceed what your file can record. In practical terms, this means detail has been lost. When highlights clip, bright areas become pure white with no recoverable texture. When shadows clip, dark areas become pure black with no visible detail.
The histogram shows clipping as peaks pushed against either edge of the graph. If you see a tall spike touching the far right wall, your highlights are clipped. A spike against the far left indicates shadow clipping. These areas contain no data, meaning no amount of editing can recover texture that was never captured.
The clipping triangles in Lightroom change color to indicate severity. A black triangle means no clipping. Gray indicates minor clipping that may be acceptable. Colored triangles (red for highlights, blue for shadows) show significant clipping that likely needs attention.
Not all clipping is bad. Sometimes you want pure black shadows for dramatic effect, or white specular highlights on shiny surfaces. The goal is understanding when clipping serves your creative vision versus when it represents a technical mistake you need to correct.
How to Use the Histogram in Lightroom to Fix Exposure Problems
Now we get to the practical application: using the histogram to identify and fix exposure issues. I have developed a systematic workflow over years of editing that makes this process reliable and repeatable.
Step 1: Enable Clipping Warnings
Before making any adjustments, press J to enable clipping warnings. Look at your image for red or blue overlay areas indicating clipped highlights or shadows. This gives you an immediate visual map of where problems exist.
Step 2: Evaluate the Histogram Shape
Examine the histogram to understand the overall tonal distribution. Is the graph bunched toward one side? Are there spikes against the edges? Does it look relatively balanced? This assessment tells you what type of exposure correction you need.
Step 3: Fix Highlight Clipping First
If you have blown highlights, start by pulling the Highlights slider to the left. Watch the histogram as you adjust. The peaks on the right side should move away from the edge. Also watch the red overlay on your image, which should disappear as you recover highlight detail.
For severe clipping, you may also need to reduce the Whites slider. The Highlights slider affects the upper portion of the tonal range, while Whites affects the very brightest values. Using both together gives you more control over the recovery process.
Step 4: Address Shadow Clipping
If you have crushed shadows, push the Shadows slider to the right. This lifts the dark values and can reveal hidden detail in shadow areas. Watch the histogram peaks move away from the left edge as you adjust.
Be careful not to overdo shadow recovery. Lifting shadows too much introduces noise and can make images look flat. The Blacks slider offers additional control over the very darkest values if needed.
Step 5: Adjust Overall Exposure
After fixing clipping, evaluate whether the overall exposure needs adjustment. The Exposure slider shifts the entire histogram left or right. Use this to set the general brightness level, then fine-tune with the other tone controls.
Step 6: Add Contrast If Needed
Fixing exposure problems sometimes results in a flat-looking image because the tonal range has been compressed. If your histogram now shows a narrow peak in the center with empty space on both sides, add contrast using the Contrast slider or Tone Curve. This spreads the tones across a wider range, creating more visual impact.
Fixing Overexposed Images
Overexposed images show a histogram with peaks pushed against the right edge. Start by reducing the Exposure slider until the peaks move away from the edge. Then use Highlights and Whites to recover any remaining clipped bright areas. For portraits with overexposed skin, be gentle with highlight recovery as it can sometimes create unnatural color shifts.
Fixing Underexposed Images
Underexposed images cluster toward the left side of the histogram. Increase the Exposure slider to shift the graph toward the center. Then lift the Shadows slider to reveal detail in dark areas. Watch for noise appearing as you lift shadows significantly. If noise becomes problematic, apply luminance noise reduction after your exposure corrections.
Advanced Histogram Techniques
Expose to the Right (ETTR)
Exposing to the right is an advanced technique where you intentionally push your exposure as bright as possible without clipping highlights. The goal is to capture maximum image quality, because digital sensors record more data in brighter tones than darker ones.
In Lightroom, you can evaluate whether your original capture followed ETTR principles by looking at the histogram. A right-biased histogram that does not quite touch the right edge indicates a good ETTR exposure. This gives you maximum flexibility in post-processing.
When editing ETTR images, you typically need to reduce exposure slightly to achieve your final look. The benefit is cleaner shadows and more tonal gradation in midtones compared to a darker capture that needed exposure boosting.
Direct Histogram Dragging
Lightroom allows you to click and drag directly on the histogram itself to make adjustments. When you hover over different areas of the histogram, the affected slider highlights in the Basic panel. Dragging left or right adjusts that slider in real-time.
This technique provides an intuitive way to shape the histogram visually. Many photographers find it faster than adjusting individual sliders. The downside is less precision, so I recommend using direct dragging for rough adjustments and the sliders for fine-tuning.
Reading the RGB Color Channels
By default, Lightroom displays the luminance histogram showing overall brightness. But you can also view individual red, green, and blue channel histograms by clicking the small RGB indicator in the top-right corner of the histogram panel. This reveals color-specific clipping that might not appear in the luminance view.
Color channel clipping can cause color shifts in extreme highlights or shadows. If you notice strange color casts after recovery, check the individual channels to see if one color is clipping more severely than others. Targeted adjustments using HSL sliders can help correct these issues.
Common Histogram Mistakes to Avoid
Through years of teaching and editing, I have seen photographers make the same histogram mistakes repeatedly. Here are the most common ones to watch for.
The first mistake is chasing a perfect histogram shape. There is no ideal histogram because every scene has different tonal requirements. A snowy landscape should have right-biased peaks. A black-background portrait will cluster left. Trust the histogram for technical information, but let your creative vision guide the final look.
Another common error is assuming all clipping is bad. Specular highlights on water, metal, or other reflective surfaces are supposed to be pure white. Deep shadows in high-contrast images can add drama. The question is whether the clipping serves your image or represents lost detail you actually wanted.
Finally, many photographers ignore the clipping warnings and rely only on their eyes. This defeats the purpose of having the histogram. Get in the habit of keeping the J key warnings active. They catch problems your monitor might not reveal.
One more pitfall is forgetting that cropping changes the histogram. When you crop an image, you remove pixels from the calculation, which shifts the histogram shape. Always recheck your histogram after cropping to ensure you have not introduced new clipping problems.
Frequently Asked Questions
How do I use histogram for correct exposure?
To use the histogram for correct exposure, look for a graph where the peaks are distributed across the tonal range without significant bunching against either edge. Peaks touching the left edge indicate underexposure with lost shadow detail. Peaks against the right edge show overexposure with blown highlights. Adjust your exposure until the histogram shows most pixels concentrated in the middle with gradual tapering toward both edges, keeping in mind that the ideal shape depends on your subject matter.
Can exposure be fixed in Lightroom?
Yes, exposure can be fixed in Lightroom using the Exposure slider in the Basic panel. For overexposed images, reduce the Exposure value and use the Highlights and Whites sliders to recover clipped bright areas. For underexposed images, increase Exposure and lift the Shadows slider to reveal hidden detail. The histogram provides real-time feedback to help you judge when the exposure correction is complete. However, severely clipped areas cannot be recovered because no data exists in those regions.
What does the histogram do in Lightroom?
The histogram in Lightroom displays the distribution of tonal values in your image as a graph. The horizontal axis represents brightness from black (left) to white (right), while the vertical axis shows how many pixels exist at each brightness level. It helps you identify exposure problems, clipping, and contrast issues that may not be visible on your monitor. The histogram is an objective tool that provides consistent feedback regardless of your display calibration or ambient lighting.
How do I fix overexposed people in Lightroom?
To fix overexposed people in Lightroom, start by reducing the Exposure slider until skin tones look natural. Then lower the Highlights slider to recover detail in bright areas like foreheads and cheekbones. Use the Whites slider sparingly for additional recovery if needed. Check the RGB histogram to ensure no color channels are clipping, which can cause skin tone shifts. For localized overexposure, use the Adjustment Brush to target specific bright areas without affecting the entire image.
What do the triangles on the Lightroom histogram mean?
The triangles on the Lightroom histogram are clipping indicators. The left triangle shows shadow clipping, and the right triangle shows highlight clipping. When a triangle lights up, it means detail is being lost in that tonal range. Clicking a triangle turns on a visual overlay on your image, blue for shadow clipping and red for highlight clipping. Press the J key to toggle these warnings on and off. Keeping clipping warnings active helps you catch exposure problems during editing.
Conclusion
Learning how to use the histogram in Lightroom to fix exposure problems transforms your editing from guesswork into a reliable, repeatable process. The histogram provides objective data about your image that your eyes and monitor simply cannot match. By understanding how to read the graph, identifying clipping, and following a systematic correction workflow, you can consistently produce well-exposed images that look great on any display.
Remember that the histogram is a tool, not a rulebook. There is no perfect histogram shape because every scene has different tonal requirements. Use the histogram to understand what is happening in your image, then apply your creative judgment to achieve the final look you want. The clipping warnings and visual overlays make this process intuitive once you develop the habit of using them.
Start practicing with your own images today. Enable the clipping warnings with the J key, watch how the histogram changes as you adjust each slider, and develop your own workflow that feels natural. Over time, reading the histogram becomes automatic, and you will catch exposure problems before they become issues in your final output.